
ACCURACY ASSESSMENT ANALYSIS OF MAPBIOMAS' LAND COVER MAPPING
ACCESS THE ACCURACY STATISTICS PANEL FOR THE COLLECTIONS
Accuracy analysis is the main way to evaluate the quality of the mapping performed by MapBiomas. In addition to stating the overall success rate, the accuracy analysis also reveals estimates of the success and error rates for each mapped class. MapBiomas evaluated the global and per-class land use and land cover accuracy for all years between 1985 and 2024.
Accuracy estimates were based on the evaluation of a pixel sample, which we call the reference database, consisting of ~ 75.000 samples. The number of pixels in the reference database was predetermined by statistical sampling techniques. Each year, each pixel from the reference database was evaluated by technicians trained in visual interpretation of Landsat images. Accuracy was assessed using metrics that compare the mapped class with the class evaluated by the technicians in the reference database. dados de referência, composta por ~85.000 amostras. O número de píxeis na base de dados de referência was pre-determined using statistical sampling techniques. Each year, each pixel in the reference dataset was assessed by technicians trained in visual interpretation of Landsat images. The accuracy assessment was conducted using metrics that compare the mapped class with the class evaluated by the technicians in the reference dataset.
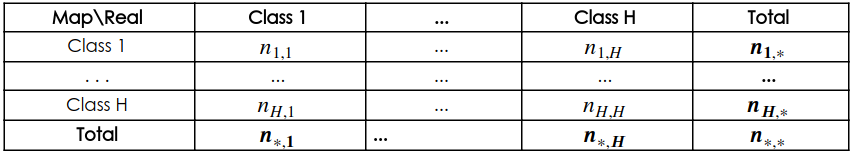
In each year, the accuracy analysis is done by cross-tabulating the sample frequencies of the mapped and real classes, in the format of Table 1. The frequencies ni,j represent the number of pixels in the sample classified as class i, and evaluated as class j. The line marginal totals,![]() , represent the number of samples mapped as class i, while the column marginal totals,
, represent the number of samples mapped as class i, while the column marginal totals,![]() , represent the number of samples that were evaluated by the technicians as class j. Table 1 is commonly called the error matrix or confusion matrix.
, represent the number of samples that were evaluated by the technicians as class j. Table 1 is commonly called the error matrix or confusion matrix.
Table 1: Generic sample error matrix
From the results in Table 1, the sample proportions in each cell of the table are estimated by ![]()
![]() . The matrix of values
. The matrix of values ![]() is used to estimate:
is used to estimate:
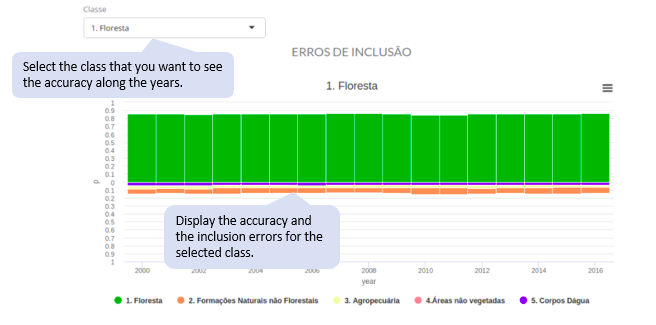
- User’s Accuracies: These are the estimates of the fractions of pixels, for each classified class, correctly classified. The user’s accuracy is associated with the error of commission, which is the error of assigning a pixel to class i, when it belongs to some other class. The user’s accuracy for class i is estimated by Formula6 and the commission error by Formula7. These metrics are associated with the reliability of each classified class.
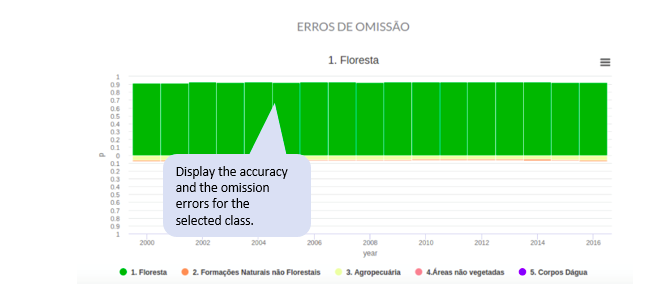
- Producer’s Accuracies: Are the sample fraction of pixels of each land cover/use class correctly assigned to their classes by the classifiers. The producer's accuracy is associated with the omission error, which occurs when we fail to map a class j pixel correctly. The producer 's accuracy for class j is estimated by
 and the omission error by
  . These metrics are associated with the sensitivity of the classifier, that is, the ability to correctly distinguish one class from another.
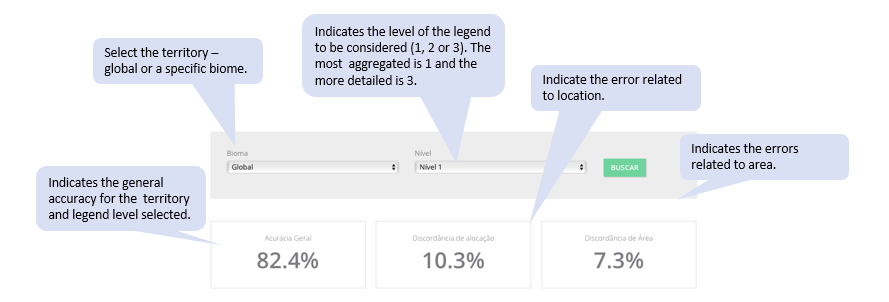
 - Global Accuracy It is the estimate of the overall hit rate. The estimate is given by Formula10 n, the sum of the main diagonal of the proportions matrix. The complement of the total accuracy, or the total error Formula11 is still decomposed into area (or quantity) disagreement and allocation disagreement1. Area disagreement measures the fraction of the error attributed to the amount of area allocated incorrectly to the classes by the mapping, while the mismatch allocation to the ratio of class-displacement errors.
The matrix also provides estimates of the different types of errors. For example, we show estimates of true class area composition in each mapping class. Thus, in addition to the hit rate of the class mapped as forest, for example, we also estimate the fraction of these areas that could be pasture or other classes of cover and land use, for each year. We understand that this level of transparency informs users and maximizes the potential of use across multiple types of users. For this, we build an aplication to facilitate the visualization of the accuracy and the errors of the mapping
ABOUT THE GRAPHICS
OVERALL STATISTICS
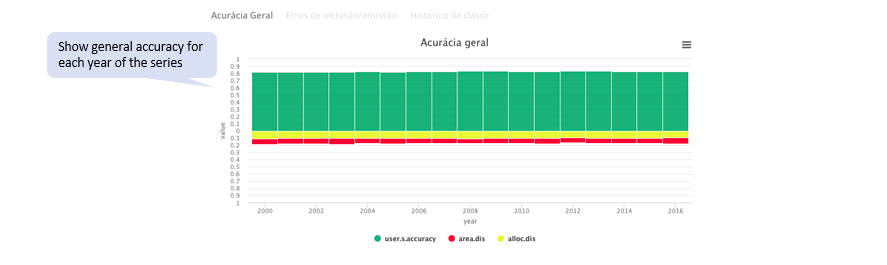
They show the mean annual total accuracy and the error, decomposed in area and allocation disagreements.
GRAPH 1. ANNUAL TOTAL ACCURACY CHART:
This graph shows the total accuracy and the total error per year. The total error is decomposed into area and allocation disagreements. Accuracy is plotted at the top and errors at the bottom of the chart.
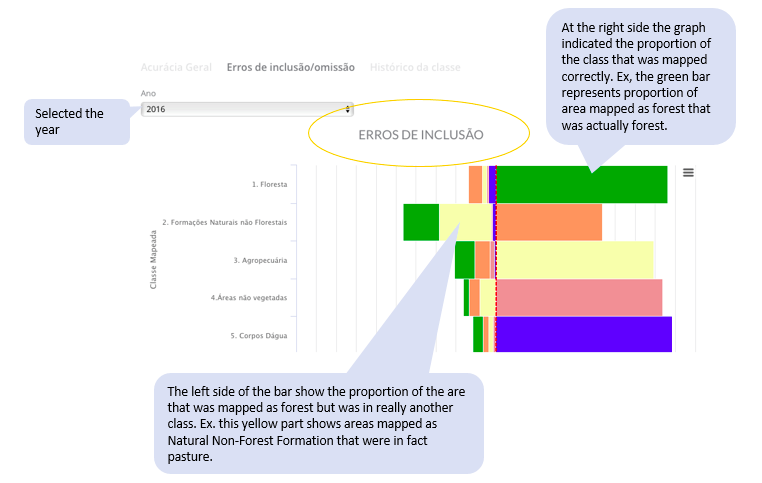
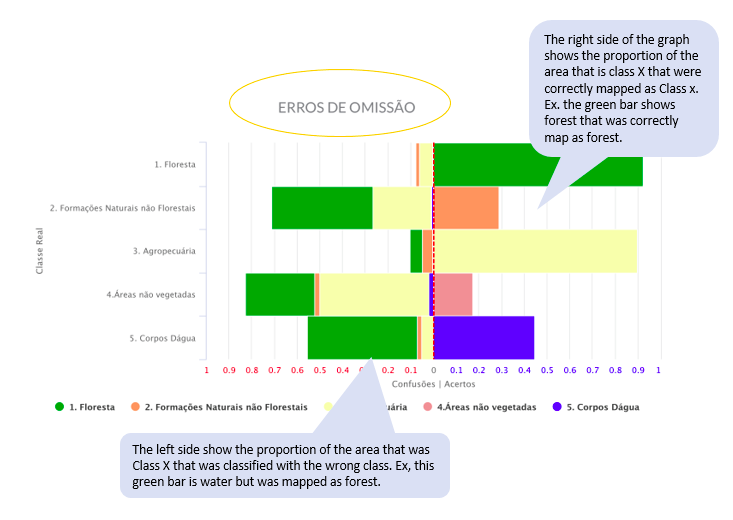
GRAPH 2. MATRIX OF ERROS:
This graph shows the user’s and producer’s accuracy, and the confusions between classes for each year. The first shows the confusions for each mapped class. The second shows the confusions for each real class.
GRAPH 3. CLASS HISTORY:
This graph allows you to inspect the confusions of a particular class over time. The user’s r and producer’s accuracies for each class is displayed along with the confusions in each year.