
Aqui apresentamos um resumo do método desenvolvido e aplicado no Monitor do Fogo do Brasil (a partir de 2019). Acesse a metodologia completa here.
GENERAL CHARACTERISTICS
The Fire Monitor is the first version of the monthly mapping of fire scars for Brazil, covering the period from 2019 onwards, based on monthly mosaics of Sentinel 2 multispectral images with spatial resolution of 10. The entire process was carried out collaboratively between the MapBiomas network institutions and using machine learning algorithms (deep learning) through the Google Earth Engine platform and Google Cloud Storage, which offer immense computational and cloud processing capacity.
The classification was organized by biomes and regions, collecting samples of burned and unburned areas to train the algorithm by regions. The method used was based on Collection 1, the respective paper published by Alencar et al. 2022.
2. METHOD OVERVIEW
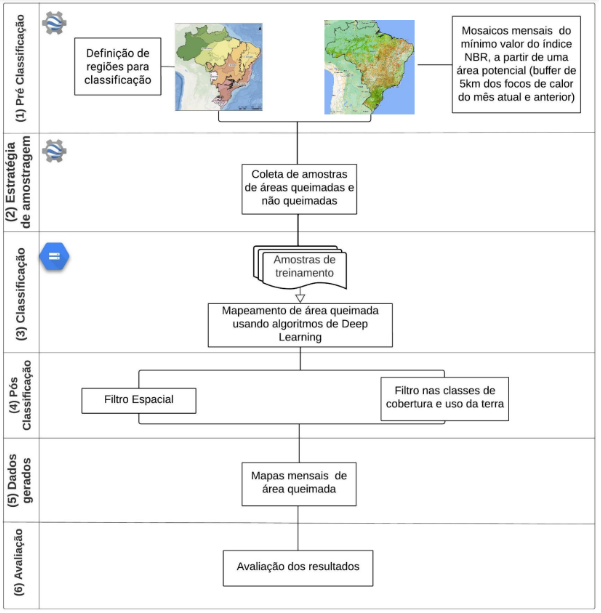
The satellite image processing and classification routines used to map the monthly burned areas in the Brazilian territory followed six steps, based on the method according to Alencar et al. 2022, which includes: (1) definition of the classification regions by biome, (2) construction of monthly Sentinel image quality mosaics, (3) collection of training samples containing spectral signatures of burned and unburned areas, (4) training and development of the deep neural network prediction model (DNN-Deep Neural Network), (5) use of post-classification routines with masks and spatial filters, and (6) evaluation of the results.
The diagram below illustrates the main steps and platforms used to classify burned areas in Brazilian biomes on a monthly basis.
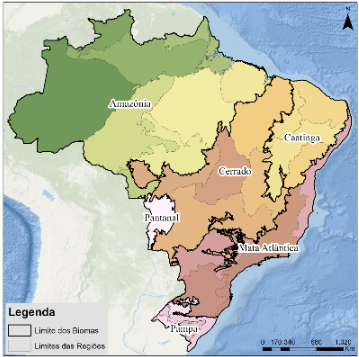
2.1. DEFINITION OF REGIONS BY BIOME
For each biome, regions were defined to collect training samples and classify burned areas by region to obtain a more accurate classification based on edaphoclimatic factors and regional vegetation. The following regions were defined for each biome:
2.2. SENTINEL MONTHLY MOSAICS
A classificação mensal de cicatrizes de fogo foi realizada usando mosaicos mensais Sentinel 2. Para remover os ruídos de nuvens foi usado uma coleção de probabilidade de nuvem do Sentinel 2 (“COPERNICUS/S2_CLOUD_PROBABILITY”), criada com a biblioteca sentinel2-cloud-detector (usando LightGBM), onde valores mais altos são mais propensos a ser nuvens ou superfícies altamente refletivas.
Para criação dos mosaicos mensais foi realizada a composição de todas as imagens disponíveis do mês em uma única imagem, usando o índice espectral mínimo NBR (Normalized Burn Ratio). Para a classificação mensal de cicatrizes de fogo também foi definida uma área potencial mensal para o mapeamento, a partir de um buffer de 5 km em torno dos focos de calor de todos os satélites disponíveis pelo INPE.
2.3. SAMPLE COLLECTION
This step consists of collecting training sample polygons of burned and unburned areas in the Sentinel mosaics for each biome region, to be used for training the classification model
2.4. CLASSIFICATION
The classification model used was the Deep Neural Network (DNN), which consists of computational models based on mathematical calculations capable of deep learning and visual pattern recognition. The structure used was the Multi-Layer Perceptron Network (MLPN). For this DNN model the input layers were the spectral bands RED, NIR, SWIR1 and SWIR2, and the output layers were the burned and unburned classes.
2.5. POST-CLASSIFICATION
After evaluating the classification results, post-classification masks were also applied to reduce possible commission errors. Rules were defined per biome to remove pixels that classified as burned in the distinct land cover and land use classes of MapBiomas Collection 7.0, as follows:
- Amazon: Rivers Lakes oceans, Urbanized area, Mining;
- Caatinga: Rivers Lakes Ocean, Aquaculture, Rock Outcropping;
- Cerrado: Rivers Ocean Lakes, Aquaculture, Urbanized Area;
- Atlantic Rainforest: Rivers Ocean Lakes, Aquaculture, Urbanized Area, Rice, Mining;
- Pampa: Rivers Ocean Lakes, Aquaculture, Urbanized Area, Mosaic of Agriculture and Pastures, Rice, Soybeans, Other Temporary Crops;
- Pantanal: Rivers Ocean Lakes, Soybeans, Other Temporary Crops.
2.6. RATING ASSESSMENT
Assessments of the classification of monthly burn scars were performed with Sentinel images, with visual inspection, statistics, and relationship with MapBiomas land cover and land use data, and comparison with reference maps (MODIS, INPE, FIRMS, FireCCi, MapBiomas Collection 1).
3. HOW TO ACCESS THE DATA
The data can be accessed in three ways.
- Through the MapBiomas platform.
- Using the download toolkit, available here.
- Pelo asset no Google Earth Engine: projects/mapbiomas-public/assets/brazil/fire/monitor/mapbiomas_fire_monthly_burned_v1