
GET TO KNOW THE STEPS OF MAPBIOMAS METHODOLOGY
Below you will find the main features, the organization of the work and the overview of the methodology of MapBiomas to generate the maps of land cover and use as well as the transition maps / land use change between different pairs of years.
You can access the ATBD (Base Document of Algorithm Theory) with all description of methodology and algorithms by going to the link below.
DOWNLOAD THE COMPLETE METHODOLOGY - ATBD
GENERAL CHARACTERISTICS
Todos os mapas anuais de cobertura e uso da terra do MapBiomas são produzidos a partir da classificação pixel a pixel de imagens Landsat. Todo processo é feito com extensivos algoritmos de aprendizagem de máquina (machine learning) através da plataforma Google Earth Engine que oferece imensa capacidade de processamento na nuvem.
BASED ON LANDSAT COLLECTION (Resolution 30 MT) | PROCESSING PIXEL BY PIXEL (30 X 30 MT) | CLOUD BASED PROCESSING |
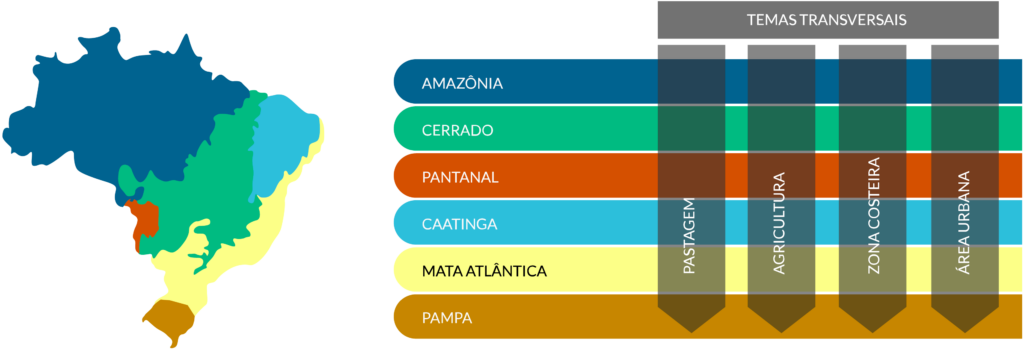
HOW WE GET ORGANIZED
In order to carry out the mapping, teams of programmers, remote sensing specialists and conservation and land use specialists are organized into teams for each biome and transversal theme that have leading institutions as shown in the diagram below.
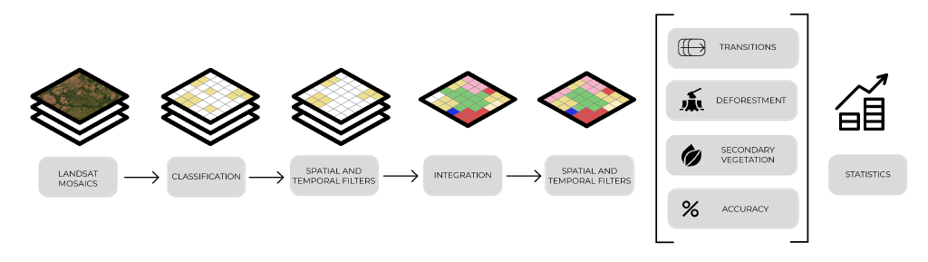
OVERVIEW OF THE METHODOLOGY
The following diagram illustrates the key steps in the process of generating the annual land cover and land use Maps of MapBiomas as well as the transition maps.