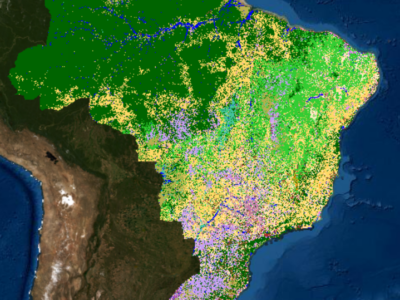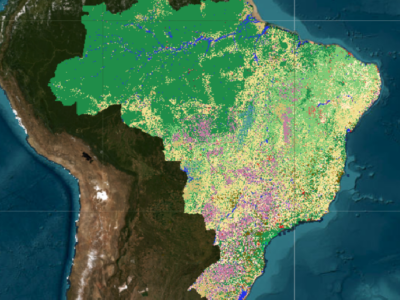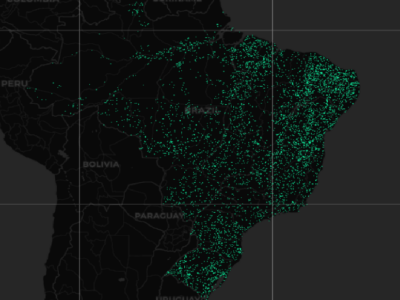

Annual collections of land cover and use maps in Brazil
Collection 10
30 classes mapped, covering 40 years of land cover and use data in Brazil (1985 - 2024)
Collection 9
29 classes mapped, covering the period from 1985 to 2023
Collection 8
29 classes mapped, covering the period from 1985 to 2022
Collection 7.1
classification improvement
Collection 7
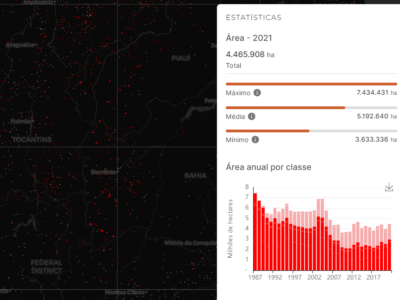
legend with 27 classes, covering the period from 1985 to 2021
Collection 6
legend with 25 classes, covering the period from 1985 to 2020
Collection 5
legend with 21 classes , covering the period from 1985 to 2019
Collection 4.1
classification improvement
Collection 4
legend with 19 classes, covering the period from 1985 to 2018
Collection 3.1
classification improvement
Collection 3
legend with 19 classes, covering the period from 1985 to 2017
Collection 2.3
collection improved due to Random Forest application
Collection 2
legend with 13 classes, covering the period from 2000 to 2016
Collection 1
simplified legend with 7 classes and covering the period 2008 to 2015.
ATTENTION: Maps in the MapBiomas Pampa collections are evolving products. Make sure to always use the latest version available. It is recommended to use MapBiomas Pampa maps up to a scale of 1:100,000. Although it is possible to view them at a larger scale (1:50,000), we do not recommend using them at this scale. The data describing the landscape dynamics for the biome are constantly developing. For more information on the methodology, visit the ATBD.