
Collection 3 of MapBiomas Soil presents annual maps of soil organic carbon stock in the 0-30 cm layer of Brazil, covering the period between 1985 and 2024 (beta version). Cross-referencing with land cover and land use data was done with Collection 10 of MapBiomas' annual land cover and land use maps of Brazil. The annual maps have a spatial resolution of 30 meters and the integer values are expressed in tons per hectare (t/ha).
In addition, MapBiomas Soil Collection 3 includes static maps of sand, silt, and clay percent content for the 0–100 cm soil layers, with a vertical resolution of 10 cm, as well as soil texture maps in six depth layers (beta version). The collection also introduces maps of soil stoniness (beta version), which express the vertical distance (cm) to dominant and extreme stoniness, defined as more than 50% and 90% of the soil volume composed of coarse fraction, respectively. The static maps have a spatial resolution of 30 meters; the granulometry maps contain integer values expressed as percentages, and the texture maps include 6, 8, and 13 classes.
All products were developed using soil sample data published in the Brazilian Soil Data Repository (SoilData, https://soildata.mapbiomas.org/). For more details on the methods used, consult the methodological description and the ATBD on the MapBiomas website (https://brasil.mapbiomas.org/metodo-mapbiomas-solo/).
The data from the latest MapBiomas Soil collection can be accessed in five ways:
1. Repositório SoilData
Download the training data for the predictive models.
The SoilData Repository hosts the soil sample data used in training the predictive models for soil properties of MapBiomas Soil. The repository is publicly accessible and does not require account creation or login.
The repository offers data citation and visualization functionalities in addition to downloads in plain text format (TXT, CSV).
The training data for the predictive models can be accessed via the links:
- Organic carbon stock: https://doi.org/10.60502/SoilData/IUZOAK
- Particle size distribution: https://doi.org/10.60502/SoilData/OXSR2N
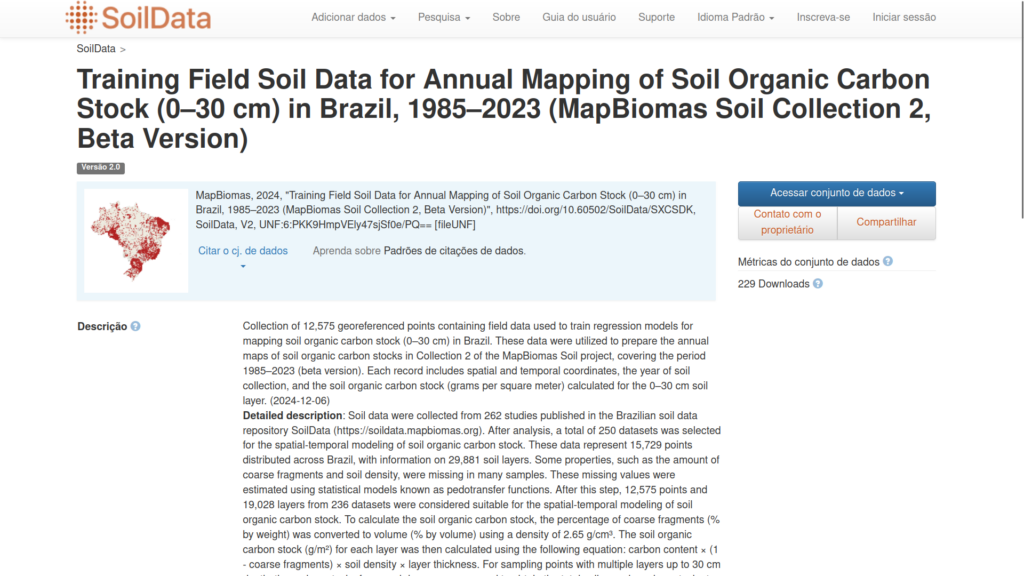
The SoilData Repository can be accessed via the following link: http://soildata.mapbiomas.org/.
2. Plataforma online de visualização e download
Explore MapBiomas Soil maps online and visualize geographic cutouts of your area of interest.
The MapBiomas platform allows visualizing maps of soil properties of Brazil. The platform is publicly accessible and does not require account creation or login, being the most user-friendly option and recommended for those seeking familiarity with the data and basic analyses.
The platform offers functionalities for online visualization of maps at different scales and geographic cutouts, years and soil depths, generation of graphs and tables with data from your area of interest, download of data in different formats, and export of figures.
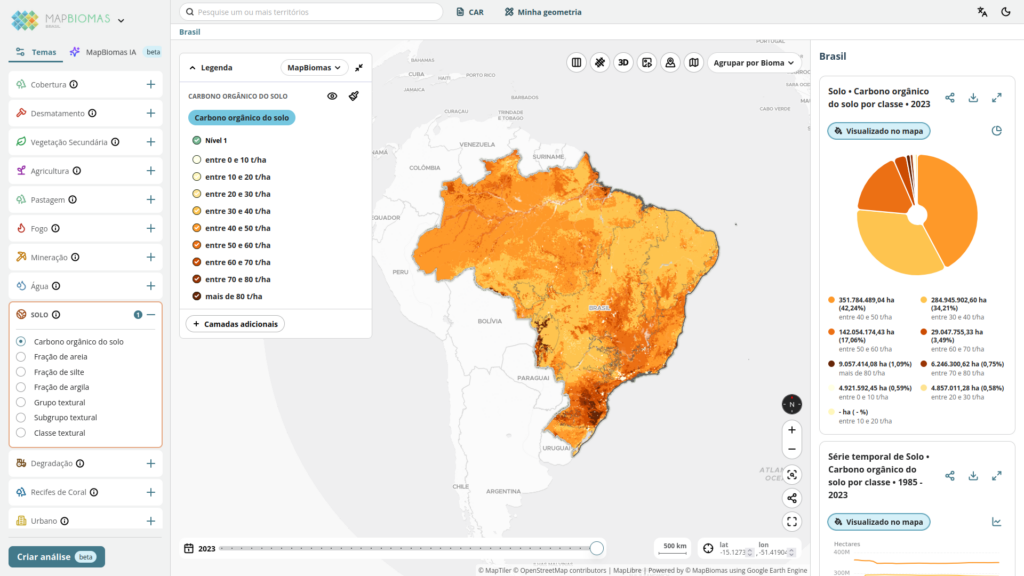
The MapBiomas platform can be accessed via the following link: https://plataforma.brasil.mapbiomas.org.
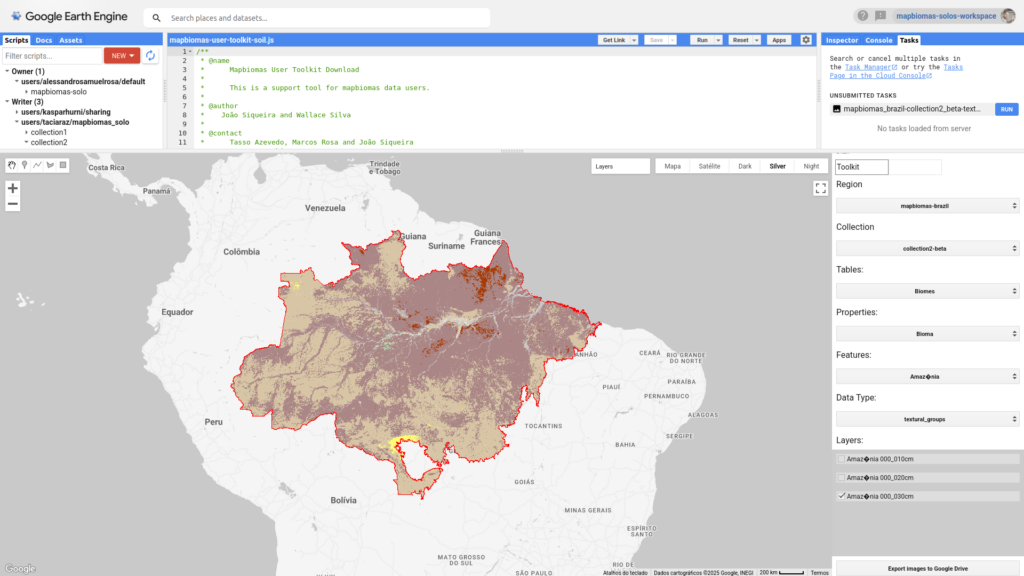
3. MapBiomas Soil Toolkit in Google Earth Engine
Export maps for selected geometries and periods.
The toolkit is a Google Earth Engine (GEE) script that allows exporting maps of soil properties for selected geometries (spatial cutouts) and periods. This is an option for accessing maps recommended for those with little experience in geoprocessing and who need to download maps for spatial cutouts. The cutouts are downloaded to your Google Drive, where you must ensure sufficient storage space.
To use the MapBiomas Soil toolkit in GEE, you need to:
- Have a Google account. If you don't have one, you can create one for free at https://accounts.google.com/signup.
- Have a project in Google Cloud. If you don't have a project, you can create one for free at https://cloud.google.com/resource-manager/docs/creating-managing-projects
- Be registered with Google Earth Engine. If you haven't registered yet, you can do so for free at https://code.earthengine.google.com/register.
Once you have your Google account, your Google Cloud project, and GEE configured, you can access the MapBiomas Soil toolkit through this link:
To help you use the toolkit, we have prepared a video tutorial and an instruction manual:
- Tutorial video https://www.youtube.com/watch?v=OBqaoSuLGbk
- Instruction manual: https://github.com/mapbiomas/user-toolkit
4. Diretório de Assets do MapBiomas no Google Earth Engine
Explore and use maps directly in GEE or via Python API.
MapBiomas Soil maps are also available in the public assets directory of the MapBiomas project in GEE. This option for accessing maps is recommended for users who wish to manipulate and use the data to perform analyses and modeling directly in GEE or via Python API, such as creating personalized maps and analyses by combining MapBiomas Soil data with other data available in GEE.
To use MapBiomas Soil maps in GEE, you need to have a Google account, a Google Cloud project, and be registered with GEE. If you don't have them yet, see the instructions in section 3. MapBiomas Soil Toolkit in Google Earth Engine.
Access the complete list of public assets of MapBiomas Soil collections here.
The address of the directory with MapBiomas Soil assets in GEE is: assets do MapBiomas Solo no GEE é:
- Collection 1 (beta): projects/mapbiomas-public/assets/brazil/soil/collection1/
- Collection 2.1 (beta): projects/mapbiomas-public/assets/brazil/soil/collection2_1/
- Collection 3 (beta): projects/mapbiomas-public/assets/brazil/soil/collection3/
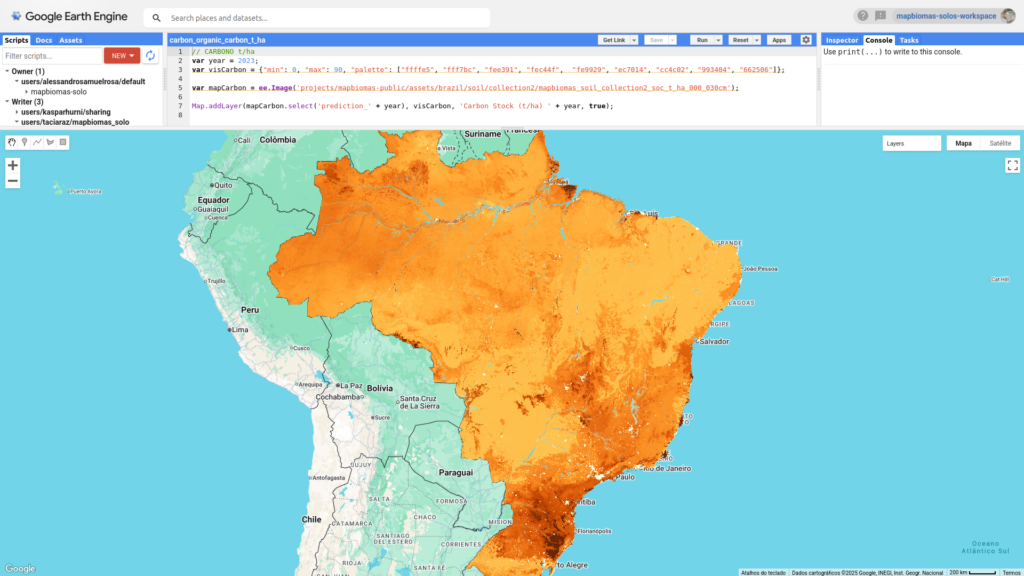
The asset with the annual maps of soil organic carbon stock of Collection 3 (beta) is:
- mapbiomas_brazil_collection3_soil_carbon_v1 - organic carbon stock in the 0-30 cm layer in t/ha.
This asset is a multiband image with 40 bands, where each band represents one of the years mapped between 1985 and 2024, named as follows:
- carbon_1985 – organic carbon stock in 1985;
- carbon_1986 – organic carbon stock in 1986;
- carbon_2024 - organic carbon stock in 2024;
Code examples:
In Collection 3 of MapBiomas Soil, the assets with the static maps of soil particle size distribution are:
- mapbiomas_brazil_collection3_soil_clay_fraction_v1 - percentage of clay;
- mapbiomas_brazil_collection3_soil_silt_fraction_v1 - percentage of silt;
- mapbiomas_brazil_collection3_soil_sand_fraction_v1 - percentage of sand.
Each of these assets is a collection with 10 images, where each image represents one of the mapped depth layers: from 0 to 100 cm, with a vertical resolution of 10 cm. For example, for clay, the 10 images are named as follows:
- clay_fraction_000_010_v1 - clay content in the 0-10 cm layer;
- clay_fraction_010_020_v1 - clay content in the 10-20 cm layer;
- clay_fraction_020_030_v1 - clay content in the 20-30 cm layer;
- clay_fraction_030_040_v1 - clay content in the 30-40 cm layer;
- clay_fraction_040_050_v1 - clay content in the 40-50 cm layer;
- clay_fraction_050_060_v1 - clay content in the 50-60 cm layer;
- clay_fraction_060_070_v1 - clay content in the 60-70 cm layer;
- clay_fraction_070_080_v1 - clay content in the 70-80 cm layer;
- clay_fraction_080_090_v1 - clay content in the 80-90 cm layer;
- clay_fraction_090_100_v1 - clay content in the 90-100 cm layer;
Code examples:
- Clay content: https://code.earthengine.google.com/?scriptPath=users%2Ftaciaraz%2Fmapbiomas_solo%3Acollection3%2Fplataform%2Fexemplos_codigos_download%2Fgranulometry_clay
- Silt content: https://code.earthengine.google.com/?scriptPath=users%2Ftaciaraz%2Fmapbiomas_solo%3Acollection3%2Fplataform%2Fexemplos_codigos_download%2Fgranulometry_silt
- Sand content: https://code.earthengine.google.com/?scriptPath=users%2Ftaciaraz%2Fmapbiomas_solo%3Acollection3%2Fplataform%2Fexemplos_codigos_download%2Fgranulometry_sand
In MapBiomas Soil Collection 3, the assets with the static soil texture maps are:
- mapbiomas_brazil_collection3_soil_textural_group_v1 - textural grouping (five classes).
- mapbiomas_brazil_collection3_soil_textural_subgroup_v1 - textural subgrouping (eight classes);
- mapbiomas_brazil_collection3_soil_textural_class_v1 - textural class (13 classes);
Each of these assets is a collection with six images, where each image represents one of the mapped depth layers at the following depths: 0–10, 0–20, 0–30, 20–40, 30–60, and 60–100 cm. For example, for the textural class map, the six images are named as follows:
- textural_class_000_010_v1 - textural class of the 0-10 cm layer;
- textural_class_000_020_v1 - textural class of the 0-20 cm layer;
- textural_class_020_040_v1 - textural class of the 20-40 cm layer;
- textural_class_000_030_v1 - textural class of the 0-30 cm layer;
- textural_class_030_060_v1 - textural class of the 30-60 cm layer;
- textural_class_060_100_v1 - textural class of the 60-100 cm layer.
Code examples:
- Textural class: https://code.earthengine.google.com/?scriptPath=users%2Ftaciaraz%2Fmapbiomas_solo%3Acollection3%2Fplataform%2Fexemplos_codigos_download%2Ftextural_classes
- Textural subgrouping: https://code.earthengine.google.com/?scriptPath=users%2Ftaciaraz%2Fmapbiomas_solo%3Acollection3%2Fplataform%2Fexemplos_codigos_download%2Ftextural_subgroups
- Textural grouping: https://code.earthengine.google.com/?scriptPath=users%2Ftaciaraz%2Fmapbiomas_solo%3Acollection3%2Fplataform%2Fexemplos_codigos_download%2Ftextural_groups
In MapBiomas Soil Collection 3, the asset with static (depth to) stoniness maps is:
- mapbiomas_brazil_collection3_soil_stoniness_v1 - vertical distance to a given stoniness threshold;
The asset is a collection with two images, where each image represents the depth (censured at 100 cm) to a stoniness threshold, as follows:
- soil_depth_stoniness_50_v1 - vertical distance to dominant stoniness (50% coarse-fragment volume);
- soil_depth_stoniness_90_v1 - vertical distance to extreme stoniness (90% coarse-fragment volume);
Code examples:
- Dominante stoniness: https://code.earthengine.google.com/?scriptPath=users%2Ftaciaraz%2Fmapbiomas_solo%3Acollection3%2Fplataform%2Fexemplos_codigos_download%2Fstoniness_dominant
- Extreme stoniness: https://code.earthengine.google.com/?scriptPath=users%2Ftaciaraz%2Fmapbiomas_solo%3Acollection3%2Fplataform%2Fexemplos_codigos_download%2Fstoniness_extreme
‘5. Google Cloud Storage
Download maps in GeoTiff format for local processing.
MapBiomas Soil maps can also be accessed directly via Google Cloud Storage. This option allows you to download individual files in GeoTiff format (WGS84, EPSG:4326) for the entirety of Brazil, making it ideal for users who do not have access to Google Earth Engine (GEE) services and prefer to process data locally.
Soil Organic Carbon Stock
This series contains 40 annual maps, covering the period from 1985 to 2024. To access a specific year, simply replace the year at the end of the link. Example (1985):
https://storage.googleapis.com/shared-development-storage/COLLECTIONS/BRASIL/SOLO/COLLECTION3/mbsoil_c03_carbon_v1/mbsoil03-carbon_1985_v1.tif
Clay Content
A set of 10 maps, each corresponding to a 10 cm depth interval. Adjust the final portion of the link to access the desired interval (e.g., 000_010cm, 020_030cm, 090_100cm). Example (000_010cm): https://storage.googleapis.com/shared-development-storage/COLLECTIONS/BRASIL/SOLO/COLLECTION3/mbsoil_c03_clay_fraction_v1/mbsoil03-clay_fraction_000_010cm_v1.tif
Sand Content
Includes 10 maps, also structured in 10 cm intervals. Modify the depth code at the end of the link (e.g., 000_010cm, 020_030cm, 090_100cm). Example (000_010cm):
https://storage.googleapis.com/shared-development-storage/COLLECTIONS/BRASIL/SOLO/COLLECTION3/mbsoil_c03_sand_fraction_v1/mbsoil03-sand_fraction_000_010cm_v1.tif
Silt Content
Composed of 10 maps in 10 cm depth layers. To access other depths, change the depth interval at the end of the link (e.g., 000_010cm, 020_030cm, 090_100cm). Example (000_010cm):
https://storage.googleapis.com/shared-development-storage/COLLECTIONS/BRASIL/SOLO/COLLECTION3/mbsoil_c03_silt_fraction_v1/mbsoil03-silt_fraction_000_010cm_v1.tif
Textural Group
Maps are available for the following depth intervals: 000_010cm, 000_020cm, 000_030cm, 020_040cm, 030_060cm, and 060_100cm. Update the depth interval at the end of the link accordingly. Example (000_010cm):
https://storage.googleapis.com/shared-development-storage/COLLECTIONS/BRASIL/SOLO/COLLECTION3/mbsoil_c03_textural_group_v1/mbsoil03-textural_group_000_010cm_v1.tif
Textural Subgroup
Available for the intervals: 000_010cm, 000_020cm, 000_030cm, 020_040cm, 030_060cm, and 060_100cm. Update the depth interval at the end of the link accordingly. Example (000_010cm):
https://storage.googleapis.com/shared-development-storage/COLLECTIONS/BRASIL/SOLO/COLLECTION3/mbsoil_c03_textural_subgroup_v1/mbsoil03-textural_subgroup_000_010cm_v1.tif
Textural Class
Also available for the intervals: 000_010cm, 000_020cm, 000_030cm, 020_040cm, 030_060cm, and 060_100cm. Update the depth interval at the end of the link accordingly. Example (000_010cm):
https://storage.googleapis.com/shared-development-storage/COLLECTIONS/BRASIL/SOLO/COLLECTION3/mbsoil_c03_textural_class_v1/mbsoil03-textural_class_000_010cm_v1.tif
Soil Stoniness
Includes two static maps corresponding to the depth to the layer with >50% and >90% coarse fraction volume. To access each map, adjust the final value in the link (e.g., 50vol, 90vol). Example (50vol):
https://storage.googleapis.com/shared-development-storage/COLLECTIONS/BRASIL/SOLO/COLLECTION3/mbsoil_c03_stoniness_v1/mbsoil03-stoniness_50vol_v1.tif
MapBiomas data are public, open and free under Creative Commons CC-BY-SA license and by referencing the source observing the following format:
“MapBiomas - Collection[version] of the [Organic Carbon/Granulometry/Soil Texture] map series for Brazil, accessed on [date] via the link: [LINK]”