

Para acesso aos Produtos do MapBiomas Fogo (incluindo Relatório Anual, assets e toolkit) acesse esse LINK
Apresentamos um resumo do método desenvolvido e aplicado na Coleção 5 do mapeamento das cicatrizes de fogo do Brasil (1985-2025). Para detalhes metodológicos completos, acesse o documento ATBD (Documento Base da Teoria do Algoritmo) neste LINK.
GENERAL CHARACTERISTICS
Todo o mapeamento de cicatrizes de fogo no Brasil foi baseado em mosaicos de imagens dos satélites Landsat com resolução espacial de 30 metros. O período de mapeamento abrange de 1985 a 2025, com dados mensais e anuais de cicatrizes de queimada cobrindo todo o território brasileiro.
O processo foi realizado de forma colaborativa entre as instituições do MapBiomas, utilizando inteligência artificial com algoritmos de aprendizagem de máquina (deep learning) na plataforma Google Earth Engine e Google Cloud Platforms, que oferecem imensa capacidade de processamento em nuvem, além de servidores locais para processamento adicional.
The work was organized by biomes and regions, with sample collection in burned and unburned areas for training the algorithm by region. In addition, reference maps were used, such as the MODIS Burned Area product (MCD64A1 – https://lpdaac.usgs.gov/products/mcd64a1v006/) with a spatial resolution of 500 m, GABAM (Global Annual Burned Area Map - https://gee-community-catalog.org/projects/gabam/) with 30 m resolution, fire hotspots, and burn scars from INPE (https://terrabrasilis.dpi.inpe.br/queimadas/bdqueimadas/).
2. VISÃO GERAL DO MÉTODO
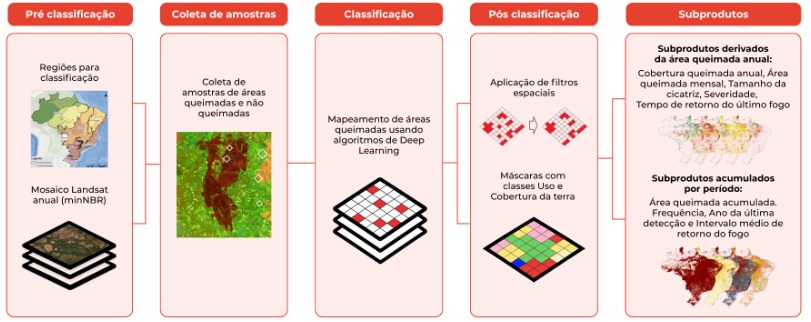
The image processing and classification routines used to map burned areas in Brazil followed six stages:
- Definition of classification regions by biome: The biomes were divided into regions to increase the accuracy of the classification.
- Creation of annual Landsat mosaics: An annual statistical approach was used to create quality annual mosaics by composing all 16-day images into a single mosaic, selecting the pixel with the lowest NBR (Normalized Burn Ratio) value.
- Collection of training samples: Spectral signatures of burned and unburned areas were collected from the annual mosaics to make up the model's training sample set.
- Classification with a Deep Learning model: The DNN (Deep Neural Network) model was trained using the collected samples and the RED, NIR, SWIR1 and SWIR2 spectral bands to classify burnt areas.
- Post-classification: Masks and spatial filters were applied to improve accuracy and reduce noise in the classification results.
- Validation with reference data and visual checks: The classification results were validated using reference data, along with visual checks.
2.1. DEFINITION OF REGIONS BY BIOME
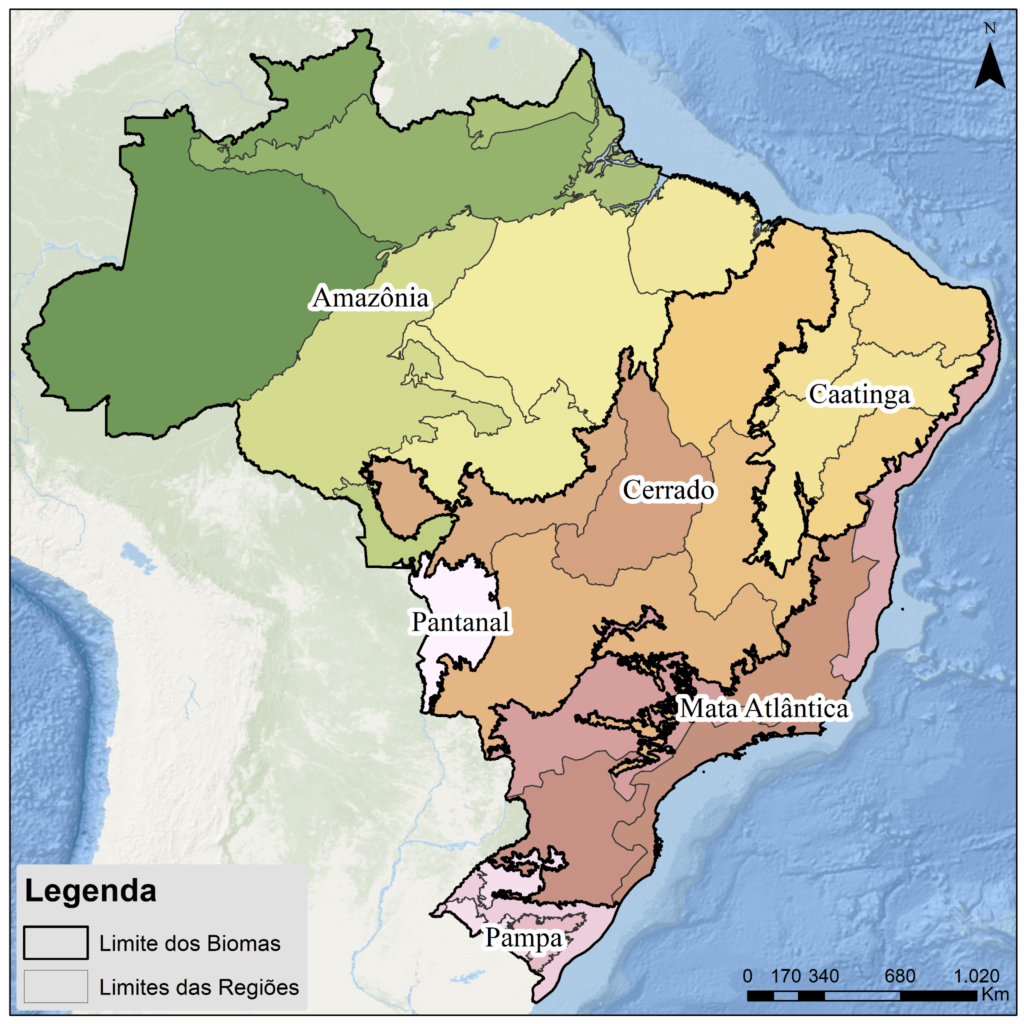
Para cada bioma, foram definidas regiões específicas para a coleta de amostras de treinamento e a classificação de áreas queimadas, com o objetivo de obter uma classificação mais precisa, baseada em fatores edafoclimáticos e na vegetação regional. As seguintes regiões foram definidas para cada bioma:
2.2. ANNUAL MOSAICS
A classificação foi realizada usando mosaicos de refletância de superfície (SR) da USGS Landsat Collection 2 (Tier 1) (30m × 30m), construídos para cada ano de 1985 a 2025. Foram avaliadas todas as cenas disponíveis dos satélites Landsat 5 (de 1985 a 2011), Landsat 7 (de 1999 a 2021), Landsat 8 (de 2013 a 2025) e Landsat 9 (de 2022 a 2025), com um intervalo de retorno de 16 dias.
2.3. SAMPLE COLLECTION
We created a spectral library based on the manual delineation of burned and unburned areas to be used as training samples. These samples were stratified by Landsat sensors (collected in different years) and by each biome. The collection of training samples was carried out across all 28 classification regions, ensuring the representation of the distinct spectral characteristics present in each region.
Thus, we obtained a sample set per sensor and for the 28 regions of Brazil, to be used for training the classification model.
2.4. CLASSIFICATION
The classification model used was the Deep Neural Network (DNN), which consists of computational models based on mathematical calculations capable of performing machine learning and visual pattern recognition.
O algoritmo de mapeamento das áreas queimadas consistiu em duas fases: treinamento e predição. Com base nas amostras de treinamento de áreas queimadas e não queimadas, as seguintes bandas espectrais foram usadas como entrada para o modelo de classificação de áreas queimadas:
- vermelho (VERMELHO – 0,65 µm),
- infravermelho próximo (NIR – 0,86 µm) e
- infravermelho de ondas curtas (SWIR 1 – 1,6 µm e SWIR 2 – 2,2 µm).
Essas bandas espectrais do Landsat foram escolhidas devido a sua sensibilidade a eventos de fogo. Os dados de treinamento foram divididos em dois conjuntos: 70% das amostras foram utilizadas para treinamento e 30% para teste.
2.5. POST-CLASSIFICATION
Após treinar e testar o modelo, a classificação foi aplicada com imagens Landsat quinzenais para todo o período de análise (1985 a 2025). Um filtro espacial foi aplicado para remoção de ruído e preenchimento de pequenas lacunas vazias: áreas menores ou iguais a 1,4 hectares (16 pixels) foram removidas, e lacunas vazias menores ou iguais a 5,8 hectares (64 pixels) foram preenchidas como áreas queimadas.
Após a avaliação dos resultados da classificação, foram aplicados filtros de pós-classificação para remover pixels que estavam nas seguintes classes de cobertura e uso da terra da Coleção 10.1 do MapBiomas nos biomas:
- Amazônia: Água, Área Urbana, Mineração, Praia, Duna e Areal
- Caatinga: Água, Área Urbana, Afloramento Rochoso
- Cerrado: Água, Área Urbana, Mineração
- Mata Atlântica: Água, Área Urbana, Arroz, Mineração, Praia, Duna e Areal
- Adicional para regiões 6 e 7: Soja, Lavouras Temporárias, Cana-de-Açúcar e Outras Lavouras Temporárias
- Pampa: Água, Área Urbana, Arroz, Mineração, Praia, Duna e Areal, Soja, Outras Lavouras Temporárias, Mosaico de Usos
- Pantanal: Soja, Algodão, Outras Lavouras Temporárias e Mineração
To obtain the information of the month in which the fire scar was mapped, postclassification processing was performed to retrieve the information of the date of the pixel that was burned from the date of the pixel in which the annual mosaic was constructed from the minimum NBR.
2.6 AVALIAÇÃO DA CLASSIFICAÇÃO
Evaluations of the fire scar classification were carried out using Landsat images, through visual inspection, statistical analysis, and correlation with MapBiomas land cover and land use data. Additionally, they were compared with reference maps, including FIRMS (1 km), GABAM (30m), MODIS MCD64A1 (500m), FIRE CCI (250m), and INPE heat spots (1 km).
3.COMO ACESSAR OS DADOS
The data can be accessed in three ways.
- Através da plataforma do MapBiomas.
- Na página de Download do MapBiomas Fogo https://brasil.mapbiomas.org/mapbiomas-fogo/ através do Toolkit, assets no Google Earth Engine e links diretos de download.